
The RTD6122CH is one of the main volume-production models among domestic 12 μm uncooled infrared detectors: a 640×512 active array, 14-bit digital output, on-chip 6-bit non-uniformity correction, and all control carried over a single SD0 serial line using in-band coding. Written for electronics engineers, this article consolidates the electrical parameters, the 408-bit configuration word, the output timing, and the debugging flow scattered across the datasheet into a single hands-on reference.
1. Device overview and array definition
The RTD6122CH is built on a vanadium oxide (VOx) microbolometer focal plane array (FPA); the readout integrated circuit (ROIC) is fabricated in CMOS and vacuum-packaged together with the sensing elements, making it a long-wave infrared (8–14 μm) uncooled detector. The output is 14-bit raw digital video: the detector performs only pixel readout and A/D conversion, while two-point NUC, defective-pixel replacement, image enhancement, and all other processing are left to the back end. The main imaging-related specifications are summarized in Table 1.
| Item | Specification (conditions) |
|---|---|
| Array size | Active array 640×512; full array 656×522 |
| Pixel pitch | 12 μm |
| Sensing element technology | VOx microbolometer |
| Spectral response | 8–14 μm long-wave infrared |
| Digital output | 14-bit, row-by-row readout, white-hot polarity |
| Frame rate | ≤60 Hz (50/30/25 Hz commonly used) |
| Thermal sensitivity | NETD <40 mK (f/1.0, 50 Hz, 300 K) |
| Thermal time constant | <12 ms |
| Power consumption | <170 mW (50 Hz, 25 °C, TEC excluded) |
| On-chip correction | 6-bit non-uniformity correction (OOC), per-pixel adjustment, effective in the current frame |
| Mirror function | Independent X- and Y-direction mirroring (configuration-word control) |
| Operability | ≥99.5% |
| Operating temperature | -40 to +85 °C |
| Package | 32-pin ceramic, 22×22×4.58 mm, weight ≤6 g |
The array definition directly determines how the acquisition logic addresses the pixel stream, so an accurate spatial picture is needed first: the detector outputs 522 rows × 656 columns, of which rows 8–519 and columns 10–649 form the active array; column 654 is the on-chip temperature-sensor output (the DTEMP column) and column 655 is the test column (the TEST column), and all 656 columns are streamed out together with the pixel data. The coordinate origin is at the top left, with row numbers increasing downward and column numbers increasing to the right, as shown in Figure 1.
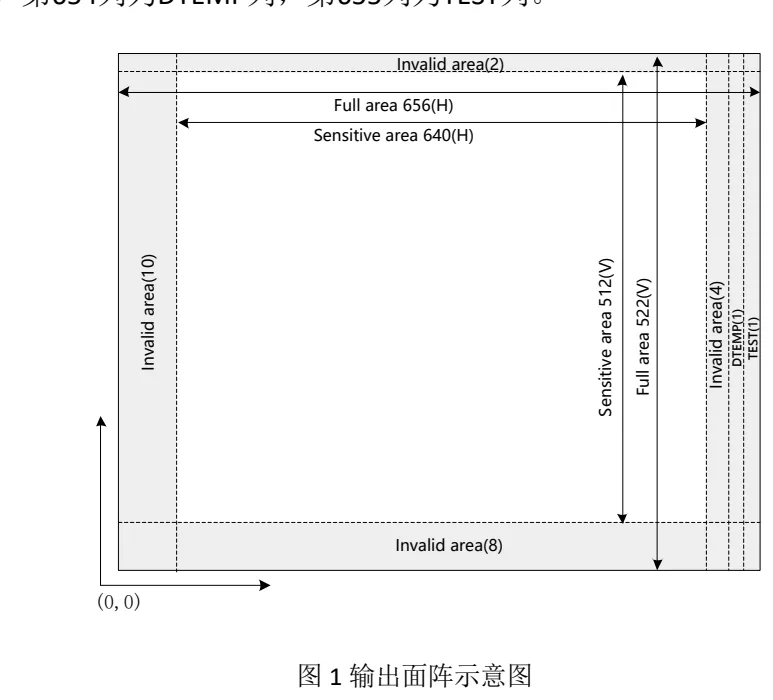
The invalid regions are not meaningless: frame-structure and reference-signal identification, as well as dark-level observation, all rely on fixed column positions; the back end likewise computes column-address mapping and defective-column replacement in full-array coordinates (see Section 7).
2. Pins and power-supply design essentials
The detector pins fall into five functional groups, as listed in Table 2. The digital I/O is powered from DVDD (1.8 V), and the interface level is LVCMOS18.
| Group | Pin | Function |
|---|---|---|
| Digital output | DO3–DO0 | Pixel data, 4-bit multiplexed, LVCMOS18 |
| Digital input | MCK | Master clock, LVCMOS18, 45–55% duty cycle |
| Digital input | SD0 | Configuration / reset / frame- and line-sync coded input, and OOC even-column data input; must be held high during power-on |
| Digital input | SD1 | OOC odd-column data input, LVCMOS18 |
| Power | VDET | Sensor bias, 11 V |
| Power | AVDD | Analog supply, 3.3 V |
| Power | DVDDH | Digital I/O supply, 3.3 V (may share a rail with AVDD, with ferrite-bead isolation) |
| Power | DVDD | Digital core supply, 1.8 V |
| Analog filtering | CAP1 / CAP2 / CAP3 | CAP1 and CAP3 each connect 1 μF to AGND; CAP2 (about 2.7 V) connects 1–10 μF (0805 package recommended) to VDET |
| Analog output | VTEMP | Off-chip temperature-sensor output, sampled by the TEC temperature-control loop |
| Temperature control | TEC+ / TEC- | Thermoelectric cooler drive |
| Ground | DGND / AGND / DETCOM | Digital ground / analog ground / sensor reference ground |
| Others | RESERVED / GETTER | Leave unconnected |
Power supply is the first pitfall in designing with this class of detector: the device is sensitive to supply noise, and noise on the analog section shows up directly in the image. The voltage windows, typical currents, and maximum allowed noise of the four supply rails are given in Table 3. Every supply pin needs 10 μF and 0.1 μF decoupling in parallel, with the 0.1 μF capacitor placed immediately next to the pin; VDET (11 V) is generated in two stages — a DC/DC boost followed by a low-noise LDO; low-noise LDOs are recommended for AVDD and DVDD (the reference design uses the ADP7102); and when DVDDH shares a rail with AVDD, it must be isolated by a ferrite bead.
| Pin | Voltage/V (min–typ–max) | Typical current/mA | Maximum noise |
|---|---|---|---|
| VDET | 10.8 – 11.0 – 11.2 | 4.89 | 30 μV |
| AVDD | 3.2 – 3.3 – 3.4 | 18.32 | 50 μV |
| DVDDH | 3.2 – 3.3 – 3.4 | 1.18 | 1 mV |
| DVDD | 1.75 – 1.8 – 1.85 | 11.69 | 1 mV |
The maximum-current figures for Table 3 are the possible maxima at 85 °C (VDET 25 mA, AVDD 25 mA, DVDDH 5 mA, DVDD 25 mA); size the supplies with margin against these values. The digital-signal levels and the interface timing constraints are given in Table 4.
| Parameter | Condition | Min | Typ | Max |
|---|---|---|---|---|
| Input high level VIH | MCK / SD0 / SD1 | 1.5 V | — | DVDD+0.3 V |
| Input low level VIL | MCK / SD0 / SD1 | -0.3 V | — | 0.3 V |
| Input leakage current | — | ±10 μA | ||
| Input capacitance | — | 2 pF | ||
| Clock duty cycle | MCK | 45% | 50% | 55% |
| Input setup time T_setup | SD relative to MCK | 1.5 ns | ||
| Input hold time T_hold | SD relative to MCK | 1.2 ns | ||
| Output rising edge Tr | 10%–90% | 0.48 ns | 0.7 ns | 1.07 ns |
| Output falling edge Tf | 10%–90% | 0.36 ns | 0.53 ns | 0.86 ns |
| Output delay Tdr | Rising edge relative to MCK | 3 ns | 4.4 ns | 6.4 ns |
| Output delay Tdf | Falling edge relative to MCK | 2.9 ns | 4.3 ns | 6.1 ns |
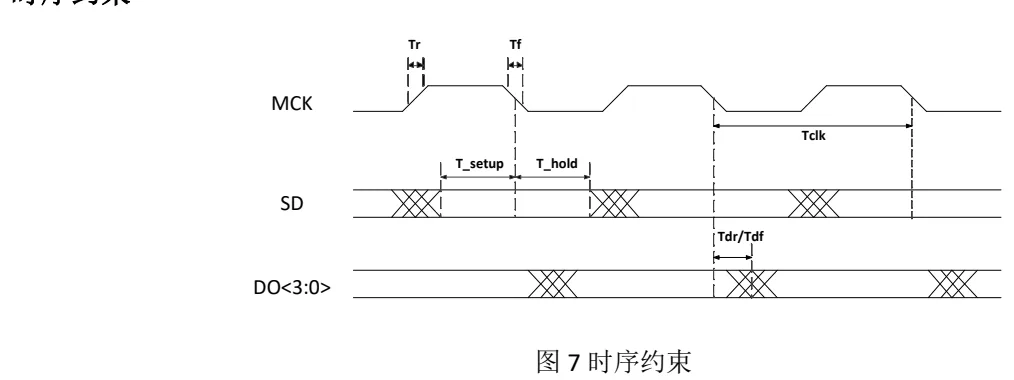
The maximum output delay of 6.4 ns is already close to the half-cycle limit (6.6 ns) at 76 MHz (13.2 ns period) — although ordinary FPGA I/O needs no dedicated source-synchronous circuitry, the sampling point must land inside the data-valid window with margin to spare (see sampling-point adjustment in Section 7). The 5 pF load condition also means the DO traces on the PCB should be kept short: the larger the load capacitance, the tighter the timing.
3. The 408-bit configuration word, field by field
All operating parameters of the detector are packed into a single 408-bit configuration word (SmartData), written once over SD0, taking effect on the next frame, and held until reset or power-down. Thirteen groups of fields in the configuration word are directly adjustable; by function they fall into four classes — operating configuration, gain adjustment, operating mode, and output adjustment — as listed in Table 5.
| Class | Field | Bit field | Default | Meaning and role in imaging mode |
|---|---|---|---|---|
| Operating configuration | XMIR | D184 | 0 | Row-direction mirror: 0 = left to right, 1 = right to left |
| YMIR | D185 | 0 | Column-direction mirror: 0 = bottom to top, 1 = top to bottom | |
| IRG<5:0> | D328–D323 | 39 | Frame rate: 39(d) = 50 Hz, 23(d) = 30 Hz, 19(d) = 25 Hz; MCK must simultaneously satisfy the line-period constraint | |
| ADDR_A<9:0> | D304–D295 | 1023 | Defective-column replacement coordinate A (0–653, full-array columns; 1023 = disabled) | |
| ADDR_B<9:0> | D314–D305 | 1023 | Defective-column replacement coordinate B; the two channels have no priority and should not be written with the same coordinate | |
| Gain adjustment | INT_CAP<2:0> | D188–D186 | 3 | Integration capacitor, 3–10 pF (000–111); sets the CTIA equivalent gain (see Table 7) |
| INT_TIME<6:0> | D175–D169 | 70 | Integration time: Tint = (INT_TIME×32+16) × TMCK | |
| RST_TIME<6:0> | D182–D176 | 7 | Analog reset time: Trst = (RST_TIME×32+16) × TMCK; constraint Trst ≥ 3 μs (50 Hz) | |
| Operating mode | SAB_EN | D362 | 1 | 0 = TCC mode, 1 = SAB (self-bias) mode; factory default is SAB |
| Output adjustment | GOF<6:0> | D202–D196 | 77 | Global offset configuration bits (positive correlation) |
| SFB_GOF<6:0> | D209–D203 | 77 | Self-bias global offset; in SAB mode this should be set the same as GOF | |
| ADC_GAIN<6:0> | D335–D329 | 55 | ADC gain adjustment (positive correlation); works with GOF to calibrate the dynamic range | |
| SFB_OOC<5:0> | D195–D190 | 32 | Array output mean adjustment in SAB mode (positive correlation); negatively correlated in TCC mode | |
| NTCC<12:0> | D223–D211 | 7686 | Array mean adjustment in TCC mode, ineffective in SAB mode; bit weights <12:5> = 1, <4> = 1/2, <3> = 1/4, <2> = 1/8, <1> = 1/16, <0> = 1/32 |
Three constraints run through every configuration combination and should be checked before writing a configuration:
- Clock constraint: MCK ≥ 2770 × 522 × frame rate — 2770 being the minimum line period (in MCK cycles). About 72.3 MHz at 50 Hz;
- Timing constraint: Trst ≥ 3 μs (at 50 Hz);
- Constant-sum constraint: INT_TIME + RST_TIME = 77 LSB — integration time and reset time trade off against each other, and the pair must be re-balanced whenever the frame rate or MCK changes.
The factory provides complete default configurations for both SAB and TCC modes at 50/25/30 Hz (for imaging use). Table 6 analyzes the three SAB-mode default configurations field by field, showing how the fields track the frame rate.
| Field | 50 Hz @ MCK=76 MHz | 25 Hz @ MCK=50 MHz | 30 Hz @ MCK=50 MHz |
|---|---|---|---|
| IRG (frame rate) | 39 (50.0 Hz) | 19 (25.0 Hz) | 23 (30.0 Hz) |
| XMIR / YMIR | 0 / 0 | 0 / 0 | 0 / 0 |
| ADDR_A / ADDR_B | 1023 / 1023 (disabled) | 1023 / 1023 | 1023 / 1023 |
| INT_CAP (integration capacitor) | 3 (6 pF) | 5 (8 pF) | 3 (6 pF) |
| INT_TIME | 70 | 70 | 70 |
| RST_TIME | 7 | 7 | 7 |
| INT+RST constant-sum check | 77 ✓ | 77 ✓ | 77 ✓ |
| Tint (actual integration time) | 29.68 μs | 45.12 μs | 45.12 μs |
| Trst (actual reset time) | 3.16 μs | 4.80 μs | 4.80 μs |
| SAB_EN | 1 (SAB) | 1 (SAB) | 1 (SAB) |
| GOF | 75 | 75 | 72 |
| SFB_GOF | 75 | 75 | 95 |
| ADC_GAIN | 57 | 62 | 64 |
| SFB_OOC | 33 | 37 | 32 |
| NTCC (ineffective under SAB) | 7686 | 7188 | 7686 |
The three configurations show a clear linkage: IRG sets the frame rate, MCK shifts gear with the frame rate, the integration capacitor sets the gain tier, and the output-adjustment fields pull the operating point back into the target window. The MCK choices — 76 MHz for 50 Hz and 50 MHz for 25/30 Hz — are the direct result of "the smallest integer MHz above the constraint minimum": at 50 Hz the minimum is 72.3 MHz, so 76 is chosen; at 25 Hz the minimum is 36.15 MHz and at 30 Hz it is 43.38 MHz, both rounded up to 50 MHz so that one clock source can be reused across the two frame rates. One caution: in the factory configuration of the 30 Hz tier, SFB_GOF (95) differs from GOF (72), whereas the manual requires the two to be identical in SAB mode; this tier is a legacy configuration, so when using it as a tuning baseline, re-check both fields first.
The choice of integration capacitor is a classic gain–dynamic-range trade-off; Table 7 gives the measured trends for the RTD6122CH at f/1, 50 Hz, 300 K (typical values).
| INT_CAP<2:0> | Integration capacitor | RMS temporal noise | Responsivity SiTF | NETD |
|---|---|---|---|---|
| 000 | 3 pF | 7.571 cnt | 285.462 cnt/K | 26.535 mK |
| 001 | 4 pF | 5.729 cnt | 212.251 cnt/K | 26.974 mK |
| 010 | 5 pF | 4.642 cnt | 169.172 cnt/K | 27.452 mK |
| 011 | 6 pF | 3.922 cnt | 140.665 cnt/K | 27.903 mK |
| 100 | 7 pF | 3.418 cnt | 120.669 cnt/K | 28.434 mK |
| 101 | 8 pF | 3.070 cnt | 104.647 cnt/K | 29.308 mK |
| 110 | 9 pF | 3.454 cnt | 92.952 cnt/K | 37.089 mK |
| 111 | 10 pF | 2.530 cnt | 83.477 cnt/K | 33.041 mK |
The larger the integration capacitor, the lower the CTIA equivalent gain and output swing; the RMS noise count falls accordingly, but NETD does not improve — it degrades, because sensitivity is set by NETD = RMS/SiTF and SiTF falls faster than RMS. The correct use of a larger INT_CAP is to compress the output swing and expand the unsaturated headroom and dynamic range (the 8 pF choice in the 25 Hz default configuration is exactly this trade-off), not to raise thermal sensitivity.
4. SD0 in-band serial timing
The RTD6122CH has no dedicated frame-sync or line-sync pins: all control functions are carried as specific serial codes on the SD0 line, and SD1 serves only as the odd-column data channel during OOC write-back. The four SD0 function codes and their priorities are listed in Table 8.
| Function | Code |
|---|---|
| Reset (RST) | 27 consecutive "1"s followed by one "0" (27×'1' + '0') |
| Configuration (CONFIG) | 1111111_1010101, followed by the continuous write of the 408-bit configuration word |
| Frame sync (FS) | 1111111_1010011 |
| Line sync (LS) | 1111111_1010111 |
After power-on, a reset code is sent first to return the internal state to a known starting point, then the configuration word is written; afterwards the detector enters steady state — one FS per frame period and one LS per line, with at least 2770 MCK cycles between the frame flag and a line flag and between adjacent line flags. The code patterns for reset and for configuration write are shown in Figures 3 and 4 respectively, and the complete frame/line sync timing in Figure 5.
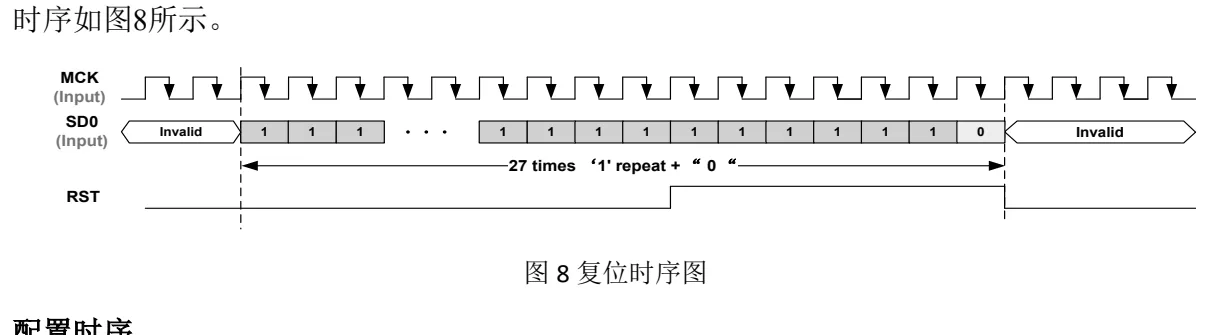

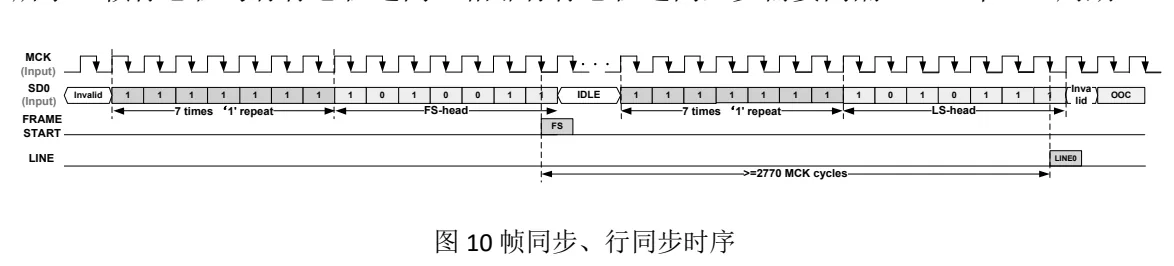
In-band coding means the back end must generate the sync sequences bit by bit: on the FPGA side, a small pattern state machine typically drives SD0, inserting FS at the start of each frame and LS at the start of each line while guaranteeing the setup/hold relationship to MCK (Table 4). A fully written configuration word takes effect on the next frame; until then the detector keeps operating on the previous configuration.
5. Pixel data output format
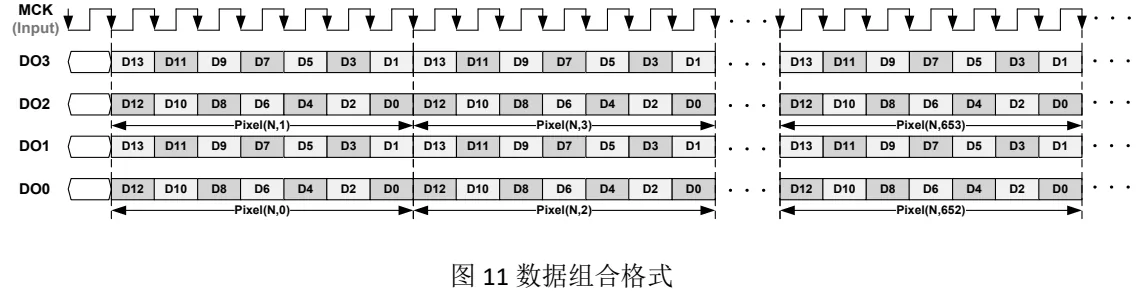
Pixel data is multiplexed out over the four lines DO3–DO0, with the basic cadence: every 7 MCK cycles deliver 2 columns of 14-bit data — DO3 and DO2 always carry the odd columns, DO1 and DO0 the even columns; within a column the 14 bits are split between the two data lines, with DO3 (DO1) outputting D13, D11, D9, D7, D5, D3, D1 in sequence over the 7 cycles and DO2 (DO0) outputting D12, D10, D8, D6, D4, D2, D0 — that is, 1 bit per line per MCK cycle, 2 bits per line pair, bit-interleaved as shown in Figure 6. The DO signals change on the falling edge of MCK; the acquisition side is advised to sample on the rising edge of MCK (see Section 7 for sampling-point optimization).
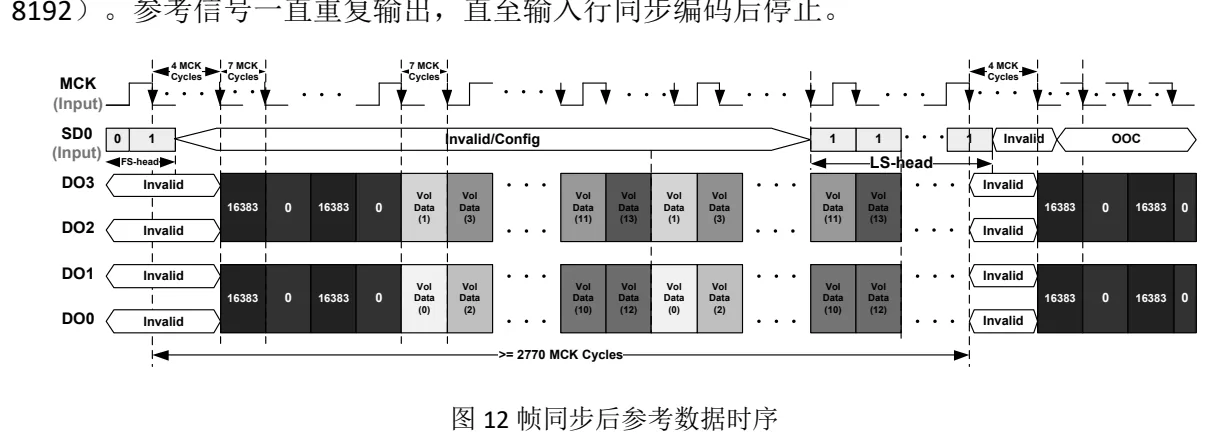
Between the frame sync / line sync and the pixel data, the output stream embeds fixed reference data: after the frame sync, 8 flag words and 14 binary-weighted reference signals repeat until the next line sync; after a line sync, the reference data is output only once, followed by the 656 columns of pixel data for that line, with the DTEMP and TEST columns embedded at the end of the data stream, as shown in Figures 7 and 8 respectively.
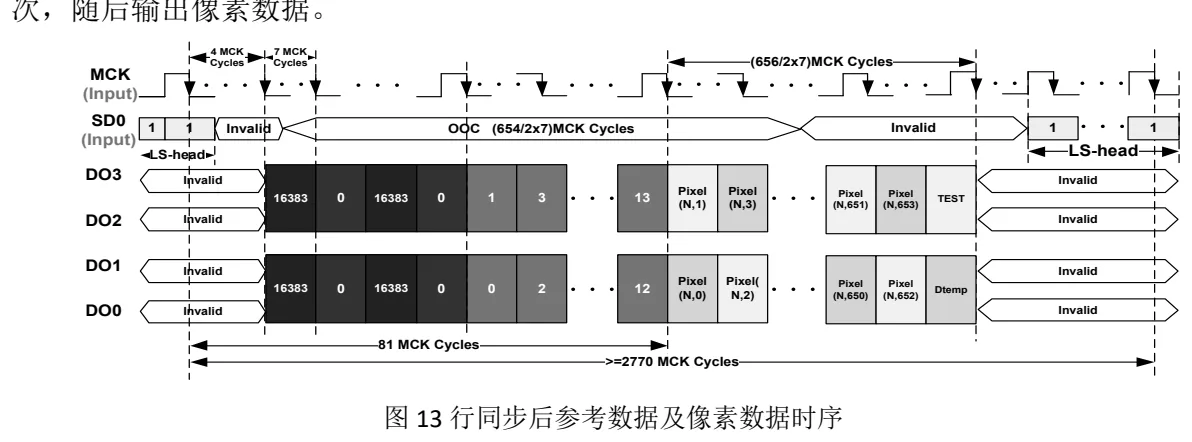
Column 654, DTEMP, is the digital output of the on-chip temperature sensor: sensitivity about -33.8 cnt/K (fitted slope -33.756, R²=0.9998), with a typical output of 6867 cnts at 20 °C; part-to-part variation is corrected per the factory TestReport. The back end should retain the DTEMP column for real-time temperature monitoring, feeding temperature-dependent compensation and the TEC control loop.
The reference signals serve to calibrate the data channel: the 14 binary-weighted references (1–8192) span the full ADC range, and the 8 full-scale/zero flag words are used to identify the frame header and channel validity. The back-end acquisition logic should verify bit order and code values in the reference-signal segment first (see first-time bring-up in Section 7) before unpacking pixel data; the invalid-region data on DO (invalid columns, DTEMP, TEST) does not participate in imaging, but the DTEMP column should be retained for temperature monitoring.
6. OOC on-chip correction and write-back
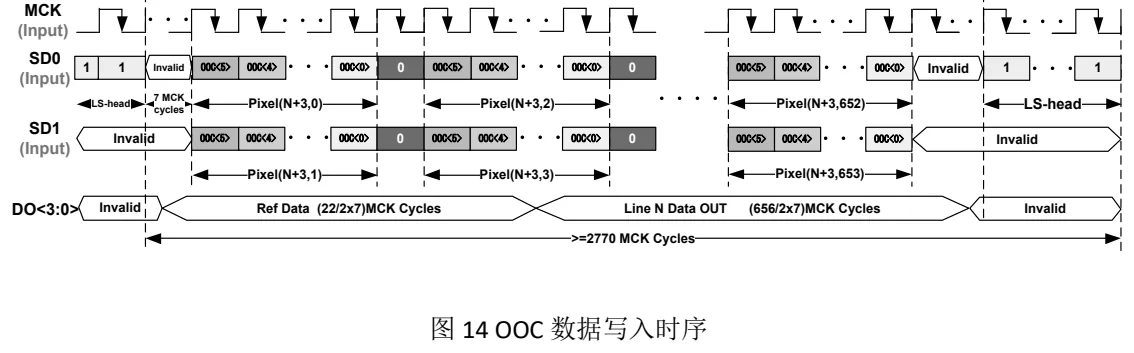
The RTD6122CH's on-chip non-uniformity correction (OOC) applies a 6-bit offset adjustment to each pixel's output: the back end computes an OOC value for every pixel and writes it back continuously over SD1 (odd columns) and SD0 (even columns) — it takes effect in the current frame and must be sent every frame. The write format is 6 bits per pixel, with adjacent data separated by a "0" bit; starting 7 MCK cycles after the line sync, the OOC data for Pixel 0–653 is written in order. While row N is being output, the correction values for row N+3 are written; after the row-521 data has been written, rows 0–2 are written back, with the timing relationship shown in Figure 9.
The adjustment direction and quantization step of the OOC are set by device characteristics: the measured OOC–DOUT curve has a linear-region slope of about -871.99 cnt/LSB (R²=0.9999) — each +1 in the OOC value lowers the pixel output by about 872 cnt. The factory calibration goal is to sweep the OOC pixel by pixel and converge the full-array output within 8000±450 cnt; the correction values are designed around "a 900-cnt target window with a step effect of about 872 cnt", which guarantees a unique feasible OOC value for every pixel.
7. Bring-up and debugging flow
The user manual divides debugging into two phases: first-time and routine. In first-time bring-up, verify each item in sequence and do not move to the next until the current one passes:
- Power-supply check: with no load (detector not connected), measure the voltage at each POWER pin with a multimeter and confirm it falls within the Table 3 windows;
- Input-signal quality confirmation: capture the MCK and SD pin waveforms on an oscilloscope, check the transmitted data for correctness, and verify that levels and setup/hold satisfy Table 4;
- Output-signal quality confirmation: with the detector connected, re-measure each supply rail, then capture the reference data after FS and LS and compare it against the reference-signal sequences in Figures 7 and 8;
- Data-acquisition confirmation: read the reference data in the acquisition logic and verify the data combination format (Figure 6) and bit order.
If the reference data is wrong at step 3, go back over steps 1–2 and confirm probe contact; if the data combination is wrong at step 4, check the bit-interleaving in the program. Keep the no-load state throughout steps 1–2 to avoid damaging the detector.
Routine debugging starts from the factory TestReport and works through four stages in order (with the lens cap on, or facing a uniform surface/blackbody, throughout):
- Configuration write: write the TestReport configuration; set the OOC of the whole array to 32(d); acquire and check the reference data and the two monitoring columns — the DTEMP column mean should fall in 6000–7000 cnt and the TEST column mean in 14000–15000 cnt;
- ADC adjustment: increase GOF by 22 LSB and write it, adjust ADC_GAIN until the TEST column mean is as close to — and below — 16383 cnt as possible, then decrease GOF by 22 LSB and write it back — the ADC input range is 0–2.4 V and the output 0–16383 cnt; this step aligns the analog swing to the ADC full scale and maximizes dynamic range;
- DC adjustment: adjust SFB_OOC so the active-array output mean falls in 7000–9000 cnt (the target operating point); this step must be redone after the operating temperature range changes;
- OOC calibration: sweep the OOC value pixel by pixel so every pixel's output enters 8000±450 cnt; calibration is complete when the peak-to-peak of the full-array output mean falls within the threshold.
Sampling-point selection is the last step and the most easily overlooked: the DO signals change on the falling edge of MCK, so start by sampling on the rising edge of MCK, then move the sampling point step by step within the valid window and pick the best setting by image quality and array RMS — the typical symptoms of a poorly chosen sampling point are sparkling pixels in the image and RMS degrading from the normal ~4 cnt to ~6 cnt.
Two further usage notes: SD0 must be held high during power-on; and pointing the lens at direct sunlight causes permanent damage to the detector — avoid it both in debugging and in use.
8. Defective column replacement
If an electrically defective column appears in the output array (an entire column stuck at 0 or 16383), it can be replaced using the 2 spare columns at the end of the full array: write the defective column's full-array coordinate (0–653, including the left-side invalid offset) into ADDR_A or ADDR_B; after replacement, the columns following the defective one automatically shift forward by 1–2 columns and the spare columns fill in at the end. The two channels have no priority and must not be written with the same coordinate; when there is no more than one defective column, keep the other channel at the default 1023. Defective-column replacement should be done after power-on, before operating-point adjustment and OOC calibration; the factory TestReport configuration already includes defective-column replacement, but you must handle it yourself in a self-developed configuration.
Conclusion
The bring-up path for the RTD6122CH can be summed up as one main line: design the supplies and interface levels per Tables 3 and 4; work out MCK and the configuration word per Section 3 (IRG sets the frame rate, MCK is the integer MHz above the constraint minimum, INT+RST sums to a constant 77); generate the SD0 in-band codes and FS/LS sequences with an FPGA state machine; unpack the DO data with the 7-MCK/2-column bit interleaving and validate the channel on the reference-signal segment; and finally run the debug chain of TestReport configuration → ADC/DC adjustment → OOC calibration → sampling-point selection. Once this timing and configuration system is understood, integrating similar detectors with custom timing is just a matter of different code patterns and configuration fields.
References
- RTD6122 Uncooled Infrared Focal Plane Detector User Manual V2.0, Raytron Technology Co., Ltd., June 2025.